At Fernandez Law Group, we help families with the divorce process every day. Therefore we wanted to find out just how much divorce rates have changed across the country and in which states people are divorced the most and least often.
To this end, we compared U.S. Census American Community Survey results from 2010- 2021 (the latest year available) to examine the issue. Below is the “State of Divorce” as of 2023.
First: U.S. Divorce Rate by State
Since 2010, the divorce rate in the United States has steadily declined. Just how much has it fallen?
Nationally, the national divorce rate has dropped nearly 28 percent from 2010 (3.83 per 1,000) to 2021 (2.76 per 1,000).
At the state level, the divorce rate decreased in all states except for one – South Dakota (6.57 percent increase). At the other end other of the spectrum, seven states experienced drops of over 40 percent. These states were Connecticut (56 percent), D.C. (49.5 percent), New Mexico (46.5 percent), Wisconsin (45.1 percent), Iowa and Kentucky (both with 43.9 percent), and Nevada (41.6 percent).
Change in Divorce Rate
Use the slider in the image below to see the differences in states between 2010 and 2021.
Which States had the Highest and Lowest Divorce Rates in Each State (2021)?
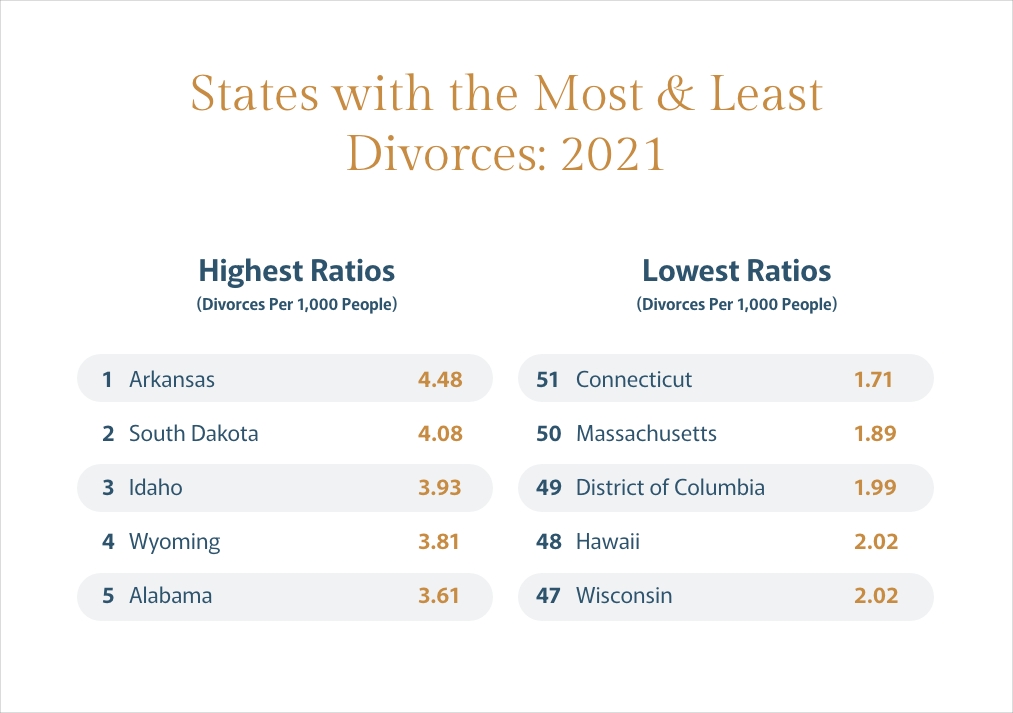
In 2021, Arkansas had the highest divorce rate in the United States at 4.48 per 1,000 people, followed by South Dakota at 4.08, and Idaho at 3.93. The three lowest divorce rates were found in Connecticut at 1.71, Massachusetts at 1.89, and D.C. at 1.99.

Divorce to Marriage Ratio: State Comparison
Of course, any examination of divorce data should also consider data on marriage. Nationally, the marriage rate has remained relatively steady compared to that of divorce, dropping by just nine percent during the observation period. In this study, we looked at both divorces and marriages each year to calculate a divorce-to-marriage ratio, expressed as Divorces Per 100 Marriages.
By this measure, there were 44 divorces for every 100 marriages in the United States in 2021. Which states have the highest and lowest ratios?

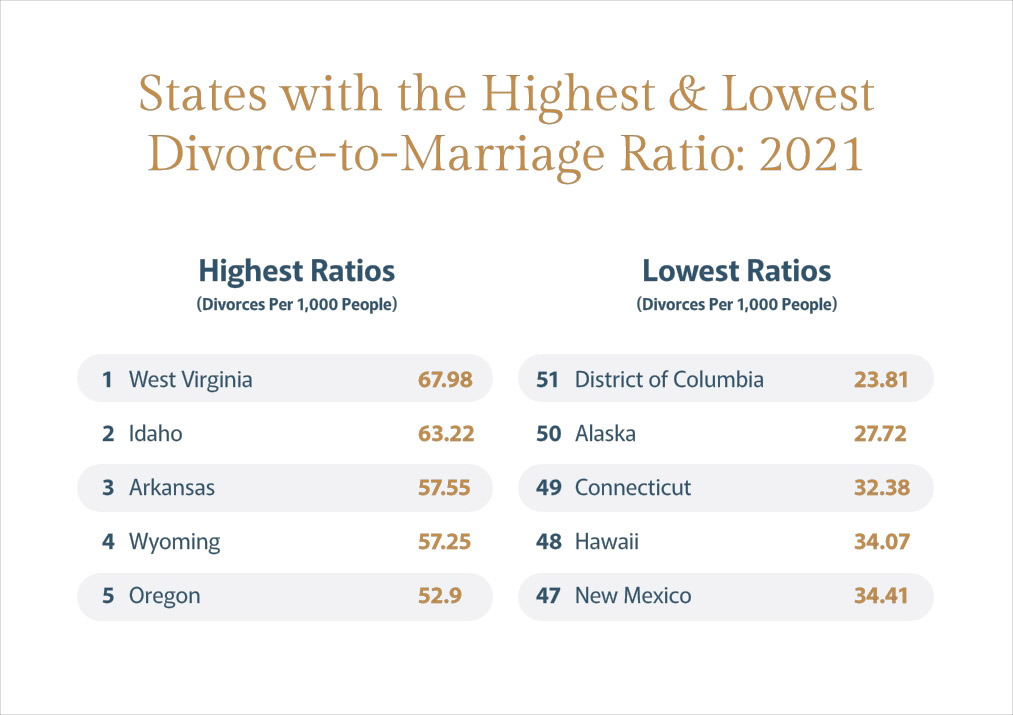
In 2021, West Virginia, Idaho, Arkansas, Wyoming, and Oregon had the highest divorce-to-marriage ratio, while D.C., Alaska, Connecticut, Hawaii, and New Mexico had the lowest.
Table: People Divorced and Married within the Last Year: 2021
The data below represents the number of people who were divorced or married in 2021 as well as the number of divorces per 100 marriages. Rank is based on the divorce-to-marriage ratio.
| Rank | State | Divorced Last Year | Married Last Year | Divorces per 100 Marriages |
|---|---|---|---|---|
| 1 | West Virginia | 6,432 | 9,462 | 67.98 |
| 2 | Idaho | 7,476 | 11,826 | 63.22 |
| 3 | Arkansas | 13,578 | 23,593 | 57.55 |
| 4 | Wyoming | 2,208 | 3,856 | 57.25 |
| 5 | Oregon | 14,578 | 27,557 | 52.90 |
| 6 | New Hampshire | 3,752 | 7,300 | 51.40 |
| 7 | Mississippi | 9,719 | 19,052 | 51.01 |
| 8 | Louisiana | 13,685 | 26,920 | 50.84 |
| 9 | North Carolina | 34,490 | 68,117 | 50.63 |
| 10 | Maryland | 16,411 | 32,575 | 50.38 |
| 11 | South Carolina | 13,704 | 27,221 | 50.34 |
| 12 | Florida | 65,472 | 130,674 | 50.10 |
| 13 | South Dakota | 3,661 | 7,316 | 50.04 |
| 14 | Tennessee | 24,821 | 50,088 | 49.55 |
| 15 | Indiana | 23,859 | 49,014 | 48.68 |
| 16 | Maine | 4,055 | 8,466 | 47.90 |
| 17 | North Dakota | 2,391 | 5,042 | 47.42 |
| 18 | Vermont | 1,639 | 3,495 | 46.89 |
| 19 | Georgia | 35,393 | 75,594 | 46.82 |
| 20 | Missouri | 19,651 | 42,783 | 45.93 |
| 21 | Iowa | 7,435 | 16,255 | 45.74 |
| 22 | Virginia | 25,940 | 57,169 | 45.37 |
| 23 | Washington | 22,023 | 48,562 | 45.35 |
| 24 | Illinois | 31,099 | 69,110 | 45.00 |
| 25 | Nevada | 9,847 | 21,889 | 44.98 |
| 26 | Ohio | 34,229 | 76,745 | 44.60 |
| 27 | Alabama | 18,215 | 40,922 | 44.51 |
| 28 | Pennsylvania | 34,113 | 77,668 | 43.92 |
| 29 | Kentucky | 13,496 | 30,817 | 43.79 |
| 30 | Texas | 88,145 | 204,975 | 43.00 |
| 31 | Delaware | 2,757 | 6,498 | 42.43 |
| 32 | Minnesota | 13,145 | 31,010 | 42.39 |
| 33 | Kansas | 8,460 | 20,002 | 42.29 |
| 34 | Michigan | 24,910 | 60,147 | 41.41 |
| 35 | New Jersey | 20,671 | 50,064 | 41.29 |
| 36 | Montana | 3,067 | 7,429 | 41.28 |
| 37 | Oklahoma | 12,975 | 31,710 | 40.92 |
| 38 | Rhode Island | 2,543 | 6,327 | 40.19 |
| 39 | Arizona | 19,340 | 48,375 | 39.98 |
| 40 | Colorado | 18,592 | 47,035 | 39.53 |
| 41 | California | 89,061 | 225,682 | 39.46 |
| 42 | New York | 42,096 | 109,013 | 38.62 |
| 43 | Utah | 10,581 | 28,909 | 36.60 |
| 44 | Massachusetts | 13,219 | 36,379 | 36.34 |
| 45 | Nebraska | 5,000 | 13,788 | 36.26 |
| 46 | Wisconsin | 11,950 | 33,480 | 35.69 |
| 47 | New Mexico | 4,534 | 13,174 | 34.41 |
| 48 | Hawaii | 2,920 | 8,569 | 34.07 |
| 49 | Connecticut | 6,186 | 19,103 | 32.38 |
| 50 | Alaska | 2,494 | 8,996 | 27.72 |
| 51 | District Of Columbia | 1,334 | 5,601 | 23.81 |
Pre and Post-Pandemic: Changes in Divorce to Marriage Ratio?
Of course, every aspect of life has been affected by the COVID-19 pandemic and response. We examined the change in the divorce-to-marriage ratio through this lens. While the ACS data for 2020 is unreliable, we compared the latest pre-pandemic year (2019), to the latest year available (2021).
- Maine saw the biggest overall increase at 82 percent, while Delaware had the biggest drop at 43 percent
- 15 states experienced a double-digit increase in the divorce-to-marriage ratio, led by three states with an increase of more than 50 percent – Maine (82 percent), South Dakota (61 percent), and Wyoming (52 percent)
- At the same time, 15 states also experienced double-digit decreases, with Delaware (43 percent), New Mexico (41 percent), and Connecticut (41 percent)
Map: Divorces per 100 Marriages in the United States
*Use the map below to visualize the divorce-to-marriage ratio for all years from 2010 to 2021.
Table: Full Data for 2019 and 2021
| Rank | State | 2019 | 2021 | Difference | %Change |
|---|---|---|---|---|---|
| 1 | Maine | 26.35 | 47.90 | 21.55 | 82% |
| 2 | South Dakota | 31.15 | 50.04 | 18.89 | 61% |
| 3 | Wyoming | 37.40 | 57.25 | 19.85 | 53% |
| 4 | Idaho | 44.78 | 63.22 | 18.43 | 41% |
| 5 | West Virginia | 51.44 | 67.98 | 16.54 | 32% |
| 6 | South Carolina | 39.75 | 50.34 | 10.59 | 27% |
| 7 | Colorado | 31.42 | 39.53 | 8.11 | 26% |
| 8 | Washington | 38.28 | 45.35 | 7.07 | 18% |
| 9 | District Of Columbia | 20.13 | 23.81 | 3.69 | 18% |
| 10 | Illinois | 38.40 | 45.00 | 6.60 | 17% |
| 11 | Nebraska | 31.16 | 36.26 | 5.10 | 16% |
| 12 | Mississippi | 44.65 | 51.01 | 6.37 | 14% |
| 13 | Iowa | 40.32 | 45.74 | 5.41 | 13% |
| 14 | Pennsylvania | 38.90 | 43.92 | 5.02 | 13% |
| 15 | Arkansas | 51.33 | 57.55 | 6.23 | 12% |
| 16 | New York | 35.57 | 38.62 | 3.05 | 9% |
| 17 | Maryland | 46.61 | 50.38 | 3.77 | 8% |
| 18 | Virginia | 42.01 | 45.37 | 3.36 | 8% |
| 19 | Louisiana | 47.40 | 50.84 | 3.43 | 7% |
| 20 | Minnesota | 39.73 | 42.39 | 2.66 | 7% |
| 21 | California | 37.51 | 39.46 | 1.96 | 5% |
| 22 | Wisconsin | 34.59 | 35.69 | 1.11 | 3% |
| 23 | New Jersey | 40.52 | 41.29 | 0.77 | 2% |
| 24 | North Carolina | 50.04 | 50.63 | 0.59 | 1% |
| 25 | New Hampshire | 50.80 | 51.40 | 0.60 | 1% |
| 26 | Oregon | 53.24 | 52.90 | -0.34 | -1% |
| 27 | Ohio | 44.95 | 44.60 | -0.34 | -1% |
| 28 | Utah | 36.95 | 36.60 | -0.35 | -1% |
| 29 | Texas | 43.46 | 43.00 | -0.45 | -1% |
| 30 | Tennessee | 50.32 | 49.55 | -0.77 | -2% |
| 31 | Georgia | 47.94 | 46.82 | -1.12 | -2% |
| 32 | Kansas | 43.63 | 42.29 | -1.34 | -3% |
| 33 | Florida | 53.57 | 50.10 | -3.47 | -6% |
| 34 | Massachusetts | 39.43 | 36.34 | -3.10 | -8% |
| 35 | Indiana | 53.43 | 48.68 | -4.76 | -9% |
| 36 | Vermont | 51.59 | 46.89 | -4.70 | -9% |
| 37 | Michigan | 45.89 | 41.41 | -4.48 | -10% |
| 38 | Missouri | 52.90 | 45.93 | -6.96 | -13% |
| 39 | North Dakota | 54.75 | 47.42 | -7.34 | -13% |
| 40 | Arizona | 46.62 | 39.98 | -6.64 | -14% |
| 41 | Oklahoma | 48.90 | 40.92 | -7.98 | -16% |
| 42 | Kentucky | 52.68 | 43.79 | -8.89 | -17% |
| 43 | Hawaii | 40.99 | 34.07 | -6.92 | -17% |
| 44 | Alabama | 54.67 | 44.51 | -10.16 | -19% |
| 45 | Montana | 50.92 | 41.28 | -9.64 | -19% |
| 46 | Nevada | 57.89 | 44.98 | -12.90 | -22% |
| 47 | Alaska | 37.96 | 27.72 | -10.24 | -27% |
| 48 | Rhode Island | 60.05 | 40.19 | -19.87 | -33% |
| 49 | Connecticut | 54.59 | 32.38 | -22.21 | -41% |
| 50 | New Mexico | 58.30 | 34.41 | -23.88 | -41% |
| 51 | Delaware | 73.94 | 42.43 | -31.51 | -43% |
Data, Methodology, and Fair Use
All data for this study comes from the U.S. Census American Community Survey, accessed through IPUMS USA, University of Minnesota, www.ipums.org.
We acknowledge that divorce and marriage rates may differ greatly depending on how it is calculated. For our purposes, all rates are based on ACS data.
If you would like to share, report on, or republish any of the data, maps, or content from this study, please link to this page to provide a citation to our work.

